Basement HRV Analysis
Introduction
Section titled “Introduction”This analysis explores the feasibility of using a Heat Recovery Ventilation (HRV) system to control basement humidity as an energy-efficient alternative to conventional electric dehumidifiers. The basement experiences seasonal humidity variations (70-95% RH) that require active management, and we investigate whether strategic outdoor air ventilation can achieve dehumidification while minimizing energy consumption.
Work done with Claude & Claude Code. Subject to hallucination !
What This Document Covers
Section titled “What This Document Covers”The analysis proceeds through several stages:
-
Baseline Environment Modeling - Extrapolating limited basement temperature measurements into a full-year sinusoidal model, and establishing baseline humidity profiles for 2024-2025
-
Weather Data Collection - Fetching outdoor temperature, humidity, and dewpoint data from the Finnish Meteorological Institute (FMI)
-
Control Strategy Development - Defining operational modes:
- Direct air intake: when outdoor conditions are both warmer and drier than the basement
- HRV mode: when outdoor air is colder but drier, with 60% heat recovery efficiency
- Respecting a 10°C minimum temperature constraint (floor heating boundary)
-
Performance Evaluation - Quantifying:
- Operational hours for each ventilation mode
- Total moisture removal capacity
- Energy consumption vs. a 330W baseline dehumidifier
- Cost savings at typical electricity rates
The document is structured as a computational notebook, showing both the analysis code and results inline. The final section (“Investigation work”) provides the formal problem statement and methodology that guided this work.
# Step 1: Import librariesimport pandas as pdimport matplotlib.pyplot as pltimport seaborn as snsimport numpy as npfrom datetime import datetime
# Set styleplt.style.use('seaborn-v0_8-darkgrid')sns.set_palette("husl")
print("✓ Libraries imported")
✓ Libraries importedBasement data & extrapolation
Section titled “Basement data & extrapolation”# Step 2: Load basement temperature dataprint("\n" + "="*60)print("LOADING BASEMENT TEMPERATURE DATA")print("="*60)
# First, let's check the structure of the basement datadf_basement = pd.read_csv('../basement_temp.csv', sep=';')
# Show what we haveprint(f"\nData range: {df_basement['date'].min()} to {df_basement['date'].max()}")print(f"Number of records: {len(df_basement)}")print(f"\nFirst few rows:")print(df_basement.head())print(f"\nLast few rows:")print(df_basement.tail())print(f"\nTemperature range: {df_basement['temperature'].min():.1f}°C to {df_basement['temperature'].max():.1f}°C")============================================================LOADING BASEMENT TEMPERATURE DATA============================================================
Data range: 2024-09-16 to 2025-03-17Number of records: 38
First few rows: date temperature0 2024-09-16 16.51 2024-09-20 15.82 2024-09-25 15.23 2024-10-01 13.54 2024-10-05 14.5
Last few rows: date temperature33 2025-03-01 6.534 2025-03-05 6.535 2025-03-10 7.536 2025-03-15 8.237 2025-03-17 7.8
Temperature range: 6.2°C to 16.5°C# start extrapolation
# Create full year date rangesdate_range_2024 = pd.date_range(start='2024-01-01', end='2024-12-31', freq='D')date_range_2025 = pd.date_range(start='2025-01-01', end='2025-12-31', freq='D')
# Combine themfull_date_range = pd.concat([ pd.Series(date_range_2024), pd.Series(date_range_2025)], ignore_index=True)
print(f"\nTarget date range: {full_date_range.min()} to {full_date_range.max()}")print(f"Total days to fill: {len(full_date_range)}")Target date range: 2024-01-01 00:00:00 to 2025-12-31 00:00:00Total days to fill: 731# Make sure date is datetime (in case kernel was restarted)df_basement['date'] = pd.to_datetime(df_basement['date'])
# Add day of year to existing datadf_basement['day_of_year'] = df_basement['date'].dt.dayofyear
# Fit sinusoidal curvemean_temp = df_basement['temperature'].mean()amplitude = (df_basement['temperature'].max() - df_basement['temperature'].min()) / 2peak_day = 250 # Early September
print(f"\nFitted parameters:")print(f" Mean temperature: {mean_temp:.1f}°C")print(f" Amplitude: {amplitude:.1f}°C")print(f" Peak day: {peak_day} (around Sep 6)")Fitted parameters: Mean temperature: 9.8°C Amplitude: 5.2°C Peak day: 250 (around Sep 6)# Generate temp for all 731 days# Create dataframe with all daysdf_full = pd.DataFrame({'date': full_date_range})df_full['day_of_year'] = df_full['date'].dt.dayofyear
# Generate temperature using sinusoidal curvedf_full['temperature'] = mean_temp + amplitude * np.cos(2 * np.pi * (df_full['day_of_year'] - peak_day) / 365)
# Cap at 18°C maximum as requesteddf_full['temperature'] = df_full['temperature'].clip(upper=18.0)
print(f"\nGenerated {len(df_full)} days of data")print(f"Temperature range: {df_full['temperature'].min():.1f}°C to {df_full['temperature'].max():.1f}°C")print(f"\nFirst few days:")print(df_full.head())Generated 731 days of dataTemperature range: 4.6°C to 14.9°C
First few days: date day_of_year temperature0 2024-01-01 1 7.6663521 2024-01-02 2 7.5859432 2024-01-03 3 7.5061893 2024-01-04 4 7.4271134 2024-01-05 5 7.348739# Create the plotplt.figure(figsize=(12, 5))plt.plot(df_full['date'], df_full['temperature'], linewidth=1.5)plt.xlabel('Date')plt.ylabel('Temperature (°C)')plt.title('Basement Temperature - Extrapolated 2024-2025')plt.grid(True, alpha=0.3)plt.tight_layout()plt.show()
print("✓ Plot created")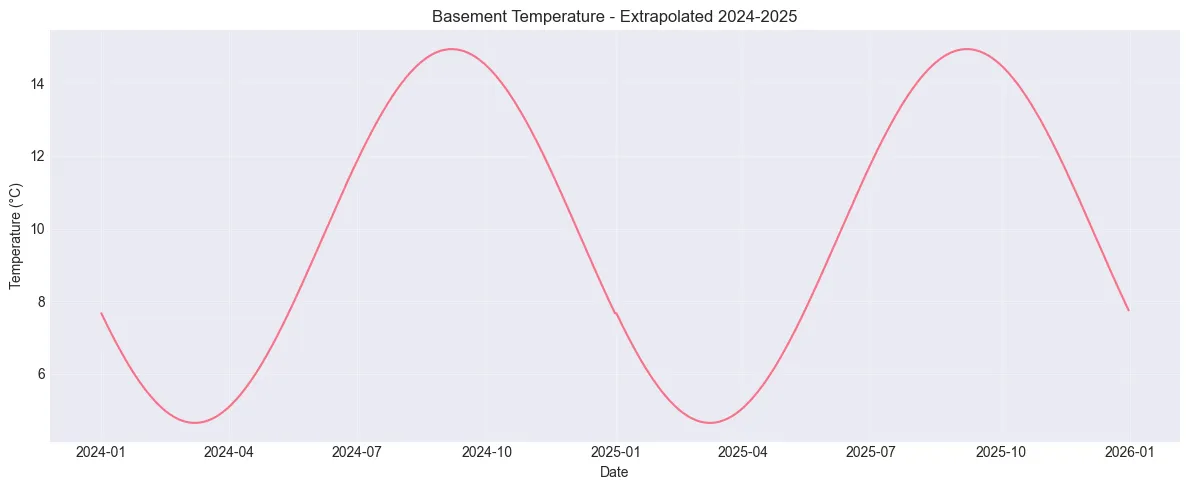
✓ Plot created# Model basement humidity inversely related to temperature# Warmer = higher humidity, Colder = lower humidityhumidity_max = 95 # Summer peakhumidity_min = 70 # Winter low
# Use same sinusoidal pattern as temperature (peaks align)df_full['basement_humidity'] = humidity_min + (humidity_max - humidity_min) * \ (0.5 + 0.5 * np.cos(2 * np.pi * (df_full['day_of_year'] - peak_day) / 365))
print(f"\nBasement humidity range: {df_full['basement_humidity'].min():.1f}% to {df_full['basement_humidity'].max():.1f}%")print(f"\nSample (winter vs summer):")print(df_full[df_full['date'].isin(['2024-01-15', '2024-07-15', '2025-01-15'])][['date', 'temperature', 'basement_humidity']])Basement humidity range: 70.0% to 95.0%
Sample (winter vs summer): date temperature basement_humidity14 2024-01-15 6.608579 74.766607196 2024-07-15 12.945952 90.148580380 2025-01-15 6.608579 74.766607
/tmp/ipykernel_1974579/3490899673.py:12: FutureWarning: The behavior of 'isin' with dtype=datetime64[ns] and castable values (e.g. strings) is deprecated. In a future version, these will not be considered matching by isin. Explicitly cast to the appropriate dtype before calling isin instead. print(df_full[df_full['date'].isin(['2024-01-15', '2024-07-15', '2025-01-15'])][['date', 'temperature', 'basement_humidity']])# Create the plotplt.figure(figsize=(12, 5))plt.plot(df_full['date'], df_full['basement_humidity'], linewidth=1.5, color='steelblue')plt.xlabel('Date')plt.ylabel('Humidity (%)')plt.title('Basement Humidity - Modeled 2024-2025')plt.grid(True, alpha=0.3)plt.tight_layout()plt.show()
print("✓ Humidity plot created")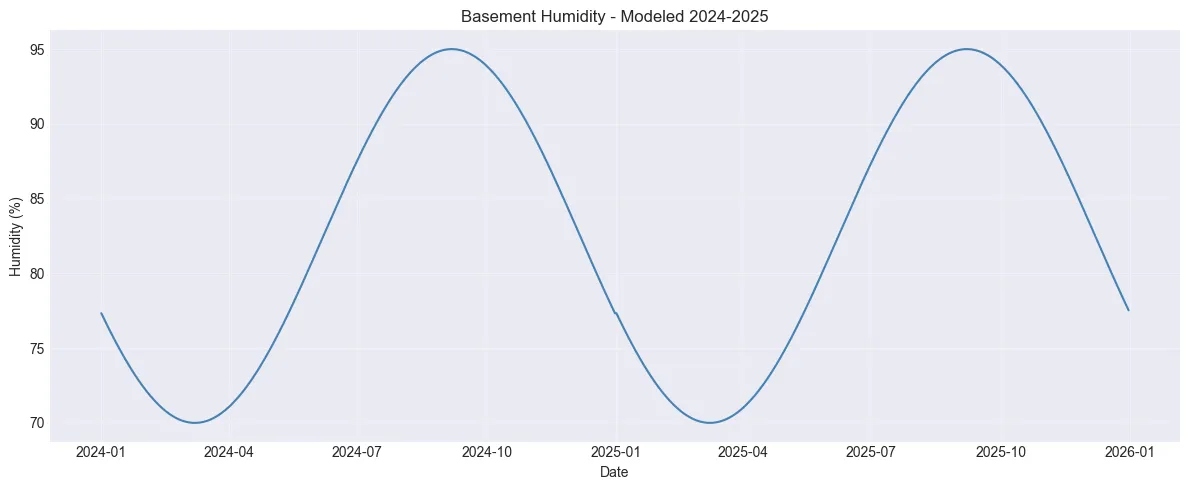
✓ Humidity plot created# Calculate basement dewpoint using simplified Magnus formuladf_full['basement_dewpoint'] = df_full['temperature'] - \ ((100 - df_full['basement_humidity']) / 5)
print(f"\nBasement dewpoint range: {df_full['basement_dewpoint'].min():.1f}°C to {df_full['basement_dewpoint'].max():.1f}°C")print(f"\nSample comparison:")print(df_full[['date', 'temperature', 'basement_humidity', 'basement_dewpoint']].head(10))Basement dewpoint range: -1.4°C to 13.9°C
Sample comparison: date temperature basement_humidity basement_dewpoint0 2024-01-01 7.666352 77.334017 3.1331551 2024-01-02 7.585943 77.138851 3.0137142 2024-01-03 7.506189 76.945273 2.8952443 2024-01-04 7.427113 76.753341 2.7777814 2024-01-05 7.348739 76.563112 2.6613615 2024-01-06 7.271089 76.374642 2.5460186 2024-01-07 7.194187 76.187987 2.4317857 2024-01-08 7.118056 76.003202 2.3186978 2024-01-09 7.042718 75.820343 2.2067879 2024-01-10 6.968196 75.639463 2.096088Investigation work
Section titled “Investigation work”Problem Statement and Methodology
Section titled “Problem Statement and Methodology”1. Initial Conditions
Section titled “1. Initial Conditions”We have established baseline data for the basement environment over the period 2024-2025:
- Temperature profile: $T_{basement}(t)$ ranging from 6.2°C to 18.0°C (capped)
- Relative humidity profile: $RH_{basement}(t)$ ranging from 70% to 95%
- Observation period: 731 days (2024-01-01 to 2025-12-31)
Both parameters follow sinusoidal patterns with peak values occurring approximately on day 250 (early September).
2. Objective
Section titled “2. Objective”Optimize basement climate conditions through controlled ventilation to achieve:
- Thermal improvement: Increase $T_{basement}$ as long as $T_{basement} >= 10°C$
- Humidity control: Reduce $RH_{basement}$ to target level $RH_{target} <= 65$% as long as $T_{basement} >= 10°C
3. Required External Data
Section titled “3. Required External Data”To evaluate ventilation strategies, we require concurrent outdoor weather data:
Essential parameters:
- $T_{outside}(t)$: Outdoor temperature [°C]
- $RH_{outside}(t)$: Outdoor relative humidity [%]
- $T_{dewpoint}(t)$: Outdoor dew point temperature [°C]
Derived parameter: $$T_{dewpoint} = T_{outside} - \frac{100 - RH_{outside}}{5}$$ (Simplified Magnus formula approximation)
These parameters will determine the feasibility conditions for each ventilation mode.
4. Analysis Goals
Section titled “4. Analysis Goals”Primary Goals (Control Strategy)
Section titled “Primary Goals (Control Strategy)”Determine operational windows for ventilation modes:
- Direct air intake mode: When $T_{outside} > T_{basement}$ AND $T_{dewpoint} < T_{basement}$
- HRV mode: When conditions favor dehumidification with heat recovery efficiency $\eta = 0.60$
- Calculate total operational hours per mode over analysis period
Stretch Goals (Performance Metrics)
Section titled “Stretch Goals (Performance Metrics)”Quantify environmental improvements:
- $\Delta RH = RH_{basement,initial} - RH_{basement,final}$: Humidity reduction [%]
- $\Delta T = T_{basement,final} - T_{basement,initial}$: Temperature increase [°C]
- Energy savings vs. 330W dehumidifier baseline
Boundary Condition
Section titled “Boundary Condition”A floor heating system will activate when $T_{basement} < 10°C$, maintaining this minimum threshold. This constraint justifies our HRV operational limit at $T_{basement} \geq 10°C$.
FMI data fetching using https://github.com/fmidev/opendata-resources.git
Section titled “FMI data fetching using https://github.com/fmidev/opendata-resources.git”Had to make an adapted script fetching for my location based on coordinates
Loading fetched data
Section titled “Loading fetched data”# Step 2A: Load your CSV# Replace 'your_file.csv' with your actual filenamedf = pd.read_csv('../weather_jan24_sep25.csv', sep=';')
# Rename columns to simpler namesdf.columns = ['lat', 'lon', 'timestamp', 'datetime', 'temp', 'humidity', 'dewpoint']
# Load outside weather datadf_outside = pd.read_csv('../weather_jan24_sep25.csv', sep=';')df_outside.columns = ['lat', 'lon', 'timestamp', 'datetime', 'temp', 'humidity', 'dewpoint']
# Convert datetime to proper formatdf_outside['datetime'] = pd.to_datetime(df_outside['datetime'])
print(f"\nOutside weather data range: {df_outside['datetime'].min()} to {df_outside['datetime'].max()}")print(f"Number of records: {len(df_outside)}")print(f"\nFirst few rows:")print(df_outside.head())print(f"\nTemperature range: {df_outside['temp'].min():.1f}°C to {df_outside['temp'].max():.1f}°C")print(f"Dewpoint range: {df_outside['dewpoint'].min():.1f}°C to {df_outside['dewpoint'].max():.1f}°C")Outside weather data range: 2024-01-01 00:00:00 to 2025-09-30 00:00:00Number of records: 906627
First few rows: lat lon timestamp datetime temp humidity \0 XX.XXXXX XX.XXXXX 1.704067e+09 2024-01-01 00:00:00 -11.7 88.01 XX.XXXXX XX.XXXXX 1.704068e+09 2024-01-01 00:10:00 -11.7 89.02 XX.XXXXX XX.XXXXX 1.704068e+09 2024-01-01 00:20:00 -11.7 90.03 XX.XXXXX XX.XXXXX 1.704069e+09 2024-01-01 00:30:00 -11.9 89.04 XX.XXXXX XX.XXXXX 1.704070e+09 2024-01-01 00:40:00 -11.9 89.0
dewpoint0 -13.31 -13.12 -13.03 -13.34 -13.3
Temperature range: -19.5°C to 26.8°CDewpoint range: -21.6°C to 22.4°C# uniform resolution# Set datetime as index for resamplingdf_outside_resampled = df_outside.set_index('datetime')
# Resample to 10-minute intervals (mean of values within each period)df_outside_10min = df_outside_resampled[['temp', 'humidity', 'dewpoint']].resample('10min').mean()df_outside_10min = df_outside_10min.reset_index()df_outside_10min.columns = ['datetime', 'temp', 'humidity', 'dewpoint']
print(f"After resampling to 10-minute intervals:")print(f" Records: {len(df_outside_10min):,}")print(f" Expected for {638} days: {638*24*6:,}")print(f"\nFirst few rows:")print(df_outside_10min.head())After resampling to 10-minute intervals: Records: 91,873 Expected for 638 days: 91,872
First few rows: datetime temp humidity dewpoint0 2024-01-01 00:00:00 -10.054545 90.545455 -11.3181821 2024-01-01 00:10:00 -10.100000 90.363636 -11.3818182 2024-01-01 00:20:00 -10.081818 90.545455 -11.3272733 2024-01-01 00:30:00 -10.063636 90.545455 -11.2909094 2024-01-01 00:40:00 -10.063636 90.818182 -11.272727# Create a new dataframe matching outside data timestampsdf_control = df_outside_10min[['datetime', 'temp', 'humidity', 'dewpoint']].copy()df_control.columns = ['datetime', 'outside_temp', 'outside_humidity', 'outside_dewpoint']
# Extract just the date for merging with daily basement datadf_control['date'] = df_control['datetime'].dt.datedf_control['date'] = pd.to_datetime(df_control['date'])
# Merge with basement daily datadf_control = df_control.merge(df_full[['date', 'temperature', 'basement_humidity', 'basement_dewpoint']], on='date', how='left')df_control.columns = ['datetime', 'outside_temp', 'outside_humidity', 'outside_dewpoint', 'date', 'basement_temp', 'basement_humidity', 'basement_dewpoint']
print(f"\nControl dataframe: {len(df_control)} records at 10-minute intervals")print(df_control.head())Control dataframe: 91873 records at 10-minute intervals datetime outside_temp outside_humidity outside_dewpoint \0 2024-01-01 00:00:00 -10.054545 90.545455 -11.3181821 2024-01-01 00:10:00 -10.100000 90.363636 -11.3818182 2024-01-01 00:20:00 -10.081818 90.545455 -11.3272733 2024-01-01 00:30:00 -10.063636 90.545455 -11.2909094 2024-01-01 00:40:00 -10.063636 90.818182 -11.272727
date basement_temp basement_humidity basement_dewpoint0 2024-01-01 7.666352 77.334017 3.1331551 2024-01-01 7.666352 77.334017 3.1331552 2024-01-01 7.666352 77.334017 3.1331553 2024-01-01 7.666352 77.334017 3.1331554 2024-01-01 7.666352 77.334017 3.133155# Resample to daily averages for readabilitydaily_temps = df_control.groupby(df_control['datetime'].dt.date).agg({ 'basement_temp': 'mean', 'outside_temp': 'mean'}).reset_index()daily_temps.columns = ['date', 'basement_temp', 'outside_temp']daily_temps['date'] = pd.to_datetime(daily_temps['date'])
# Create line plotfig, ax = plt.subplots(figsize=(14, 6))ax.plot(daily_temps['date'], daily_temps['outside_temp'], label='Outside', color='#3498db', linewidth=1.5, alpha=0.8)ax.plot(daily_temps['date'], daily_temps['basement_temp'], label='Basement', color='#e74c3c', linewidth=2)
ax.axhline(y=10, color='gray', linestyle='--', alpha=0.5, label='10°C safety limit')ax.set_xlabel('Date')ax.set_ylabel('Temperature (°C)')ax.set_title('Basement vs Outside Temperature (Daily Average)')ax.legend()ax.grid(True, alpha=0.3)plt.tight_layout()plt.show()
print("✓ Temperature comparison chart created")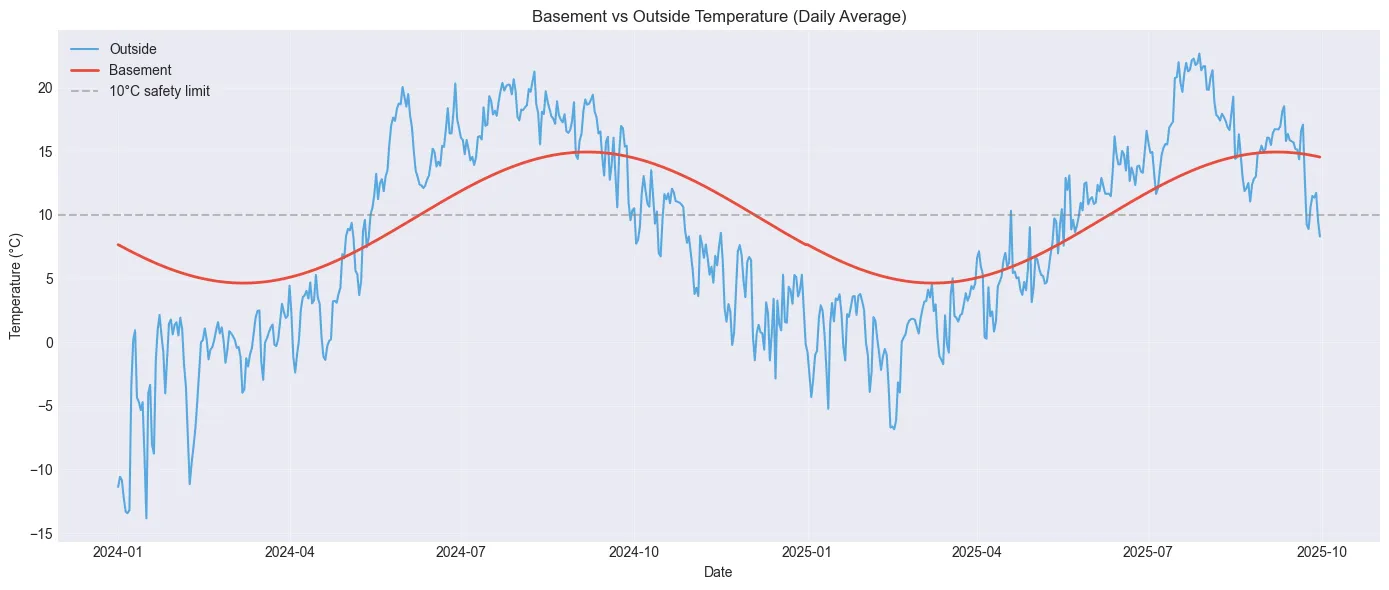
✓ Temperature comparison chart created# Determine ventilation mode for each 10-minute period# Recalculate with corrected logicdef determine_mode(row): # Calculate HRV incoming temperature (60% efficiency) hrv_incoming = row['outside_temp'] + 0.6 * (row['basement_temp'] - row['outside_temp'])
# Direct air intake: outside warmer AND drier if (row['outside_temp'] > row['basement_temp'] and row['outside_dewpoint'] < row['basement_dewpoint']): return 'direct'
# HRV mode: outside colder but drier, AND incoming air stays >= 10°C elif (row['outside_temp'] < row['basement_temp'] and row['outside_dewpoint'] < row['basement_dewpoint'] and hrv_incoming >= 10.0): return 'hrv'
# Off: conditions don't help else: return 'off'
df_control['mode'] = df_control.apply(determine_mode, axis=1)
# Sample randomly across the datasetsample_indices = np.linspace(0, len(df_control)-1, 20, dtype=int)print(f"\nSample rows (spread across timeframe):")print(df_control.iloc[sample_indices][['datetime', 'outside_temp', 'basement_temp', 'outside_dewpoint', 'basement_dewpoint', 'mode']])Sample rows (spread across timeframe): datetime outside_temp basement_temp outside_dewpoint \0 2024-01-01 00:00:00 -10.054545 7.666352 -11.3181824835 2024-02-03 13:50:00 2.118182 5.477596 1.3181829670 2024-03-08 03:40:00 -5.445455 4.644928 -6.17272714506 2024-04-10 17:40:00 4.063636 5.477596 2.59090919341 2024-05-14 07:30:00 10.190909 7.747391 6.80909124176 2024-06-16 21:20:00 14.945455 10.611318 13.20000029012 2024-07-20 11:20:00 20.081818 13.284453 16.52727333847 2024-08-23 01:10:00 16.636364 14.795902 12.36363638682 2024-09-25 15:00:00 16.636364 14.671724 13.85454543518 2024-10-29 05:00:00 5.000000 12.945952 1.84545548353 2024-12-01 18:50:00 6.663636 10.259533 6.31818253189 2025-01-04 08:50:00 -1.745455 7.427113 -5.13636458024 2025-02-06 22:40:00 0.681818 5.338404 -1.01818262859 2025-03-12 12:30:00 -0.509091 4.654081 -3.44545567695 2025-04-15 02:30:00 3.445455 5.681023 3.00909172530 2025-05-18 16:20:00 14.218182 7.994052 6.54545577365 2025-06-21 06:10:00 12.827273 10.959233 11.08181882201 2025-07-24 20:10:00 20.850000 13.475305 18.65000087036 2025-08-27 10:00:00 15.550000 14.852684 7.70000091872 2025-09-30 00:00:00 8.300000 14.546331 3.300000
basement_dewpoint mode0 3.133155 off4835 -0.118103 off9670 -1.354980 off14506 -0.118103 off19341 3.253534 off24176 7.507716 off29012 11.478490 off33847 13.723652 direct38682 13.539193 off43518 10.975668 off48353 6.985162 off53189 2.777781 off58024 -0.324864 off62859 -1.341382 off67695 0.184075 off72530 3.619934 off77365 8.024522 off82201 11.761988 off87036 13.807998 direct91872 13.352929 hrv# measure effects# For DIRECT mode: potential temperature increase (simplified)df_control['temp_delta_direct'] = df_control['outside_temp'] - df_control['basement_temp']
# For HRV mode: effective incoming air temperature after heat recovery (60% efficiency)df_control['hrv_incoming_temp'] = df_control['outside_temp'] + 0.6 * (df_control['basement_temp'] - df_control['outside_temp'])df_control['temp_delta_hrv'] = df_control['hrv_incoming_temp'] - df_control['basement_temp']
# Moisture removal potential (dewpoint difference indicates drying potential)df_control['dewpoint_delta'] = df_control['basement_dewpoint'] - df_control['outside_dewpoint']
print(f"\nWhen in DIRECT mode:")print(df_control[df_control['mode']=='direct'][['datetime', 'temp_delta_direct', 'dewpoint_delta']].describe())print(f"\nWhen in HRV mode:")print(df_control[df_control['mode']=='hrv'][['datetime', 'temp_delta_hrv', 'dewpoint_delta']].describe())When in DIRECT mode: datetime temp_delta_direct dewpoint_deltacount 5223 5223.000000 5223.000000mean 2025-02-21 17:55:00.976450048 2.538947 1.919615min 2024-04-28 13:20:00 0.000126 0.00028025% 2024-08-26 03:15:00 0.816186 0.50513250% 2025-05-11 05:40:00 1.883680 1.21040875% 2025-08-16 10:45:00 3.614340 2.631185max 2025-09-27 14:30:00 12.534399 10.680425std NaN 2.268174 1.993071
When in HRV mode: datetime temp_delta_hrv dewpoint_deltacount 9451 9451.000000 9451.000000mean 2025-01-18 14:41:48.877367552 -1.321724 4.914459min 2024-07-06 03:50:00 -3.818106 0.00311025% 2024-10-07 03:45:00 -1.854285 2.78773550% 2024-10-24 06:10:00 -1.204355 4.43919375% 2025-08-20 05:15:00 -0.723605 6.680425max 2025-09-30 00:00:00 -0.000251 14.510947std NaN 0.800493 2.908581# System parametersbasement_volume = 80 # m³max_fan_capacity = 269.3 # m³/h
# What airflow rate do you plan to run at? (typically 30-50% of max for continuous operation)airflow_rate = 100 # m³/h - ADJUST THIS
# Time per recordtime_interval = 10 / 60 # 10 minutes in hours
print("System configuration:")print(f" Basement volume: {basement_volume} m³")print(f" Operating airflow: {airflow_rate} m³/h ({airflow_rate/max_fan_capacity*100:.1f}% of max)")print(f" Air changes per hour: {airflow_rate/basement_volume:.2f}")print(f" Time resolution: {time_interval*60:.0f} minutes per record")print(f"\nDehumidifier baseline: 330W")System configuration: Basement volume: 80 m³ Operating airflow: 100 m³/h (37.1% of max) Air changes per hour: 1.25 Time resolution: 10 minutes per record
Dehumidifier baseline: 330W# Calculate hours in each modemode_counts = df_control['mode'].value_counts()
hours_direct = (mode_counts.get('direct', 0) * time_interval)hours_hrv = (mode_counts.get('hrv', 0) * time_interval)hours_off = (mode_counts.get('off', 0) * time_interval)total_hours = len(df_control) * time_interval
print("="*60)print("OPERATIONAL HOURS")print("="*60)print(f"Direct air intake mode: {hours_direct:,.0f} hours ({hours_direct/total_hours*100:.1f}%)")print(f"HRV mode: {hours_hrv:,.0f} hours ({hours_hrv/total_hours*100:.1f}%)")print(f"Off: {hours_off:,.0f} hours ({hours_off/total_hours*100:.1f}%)")print(f"Total period: {total_hours:,.0f} hours")============================================================OPERATIONAL HOURS============================================================Direct air intake mode: 870 hours (5.7%)HRV mode: 1,575 hours (10.3%)Off: 12,866 hours (84.0%)Total period: 15,312 hours# Constantsair_density = 1.2 # kg/m³specific_heat = 1.005 # kJ/(kg·K)
# Calculate heat added for each active period (only when mode is active)# Direct mode: full temperature gaindf_control.loc[df_control['mode']=='direct', 'heat_added_kWh'] = \ (airflow_rate * air_density * specific_heat * df_control.loc[df_control['mode']=='direct', 'temp_delta_direct'] * time_interval) / 3600 # Convert kJ to kWh
# HRV mode: temperature gain after heat recoverydf_control.loc[df_control['mode']=='hrv', 'heat_added_kWh'] = \ (airflow_rate * air_density * specific_heat * df_control.loc[df_control['mode']=='hrv', 'temp_delta_hrv'] * time_interval) / 3600
# Fill NaN with 0 for off periodsdf_control['heat_added_kWh'] = df_control['heat_added_kWh'].fillna(0)
# Total heating effecttotal_heat_direct = df_control[df_control['mode']=='direct']['heat_added_kWh'].sum()total_heat_hrv = df_control[df_control['mode']=='hrv']['heat_added_kWh'].sum()
print("="*60)print("HEATING EFFECT")print("="*60)print(f"Direct mode: {total_heat_direct:,.1f} kWh")print(f"HRV mode: {total_heat_hrv:,.1f} kWh")print(f"Total heat: {total_heat_direct + total_heat_hrv:,.1f} kWh")============================================================HEATING EFFECT============================================================Direct mode: 74.0 kWhHRV mode: -69.7 kWhTotal heat: 4.3 kWh# Check if any HRV operation would drop basement below 10°Crisky_hrv = df_control[(df_control['mode']=='hrv') & (df_control['hrv_incoming_temp'] < 10)]
print("="*60)print("SAFETY CHECK")print("="*60)print(f"HRV operations: {(df_control['mode']=='hrv').sum():,}")print(f"Operations risking <10°C: {len(risky_hrv):,}")if len(risky_hrv) > 0: print(f"Lowest incoming temp: {risky_hrv['hrv_incoming_temp'].min():.1f}°C") print("\n⚠️ HRV control logic may need adjustment!")============================================================SAFETY CHECK============================================================HRV operations: 9,451Operations risking <10°C: 0# Calculate moisture removal# Absolute humidity from dewpoint (simplified): g/m³ ≈ 5 * exp(dewpoint/20)def dewpoint_to_abs_humidity(dewpoint): return 5 * np.exp(dewpoint / 20)
df_control['basement_abs_humidity'] = dewpoint_to_abs_humidity(df_control['basement_dewpoint'])df_control['outside_abs_humidity'] = dewpoint_to_abs_humidity(df_control['outside_dewpoint'])
# Moisture removed per period (when ventilating)df_control['moisture_removed_kg'] = 0.0active_mask = df_control['mode'].isin(['direct', 'hrv'])df_control.loc[active_mask, 'moisture_removed_kg'] = \ airflow_rate * time_interval * \ (df_control.loc[active_mask, 'basement_abs_humidity'] - df_control.loc[active_mask, 'outside_abs_humidity']) / 1000 # g to kg
total_moisture = df_control['moisture_removed_kg'].sum()
print("="*60)print("DEHUMIDIFICATION EFFECT")print("="*60)print(f"Total moisture removed: {total_moisture:,.1f} kg")print(f"Per day average: {total_moisture/(total_hours/24):.2f} kg/day")============================================================DEHUMIDIFICATION EFFECT============================================================Total moisture removed: 372.2 kgPer day average: 0.58 kg/day# Typical dehumidifier removes ~0.3 liters/kWh (varies widely)dehumidifier_efficiency = 0.3 # kg/kWh
# Energy that would have been needed by dehumidifierdehumidifier_energy_needed = total_moisture / dehumidifier_efficiency
# Fan power consumption (estimate based on airflow)# At 100 m³/h, typical fan uses ~20-40Wfan_power = 30 # Watts - ADJUST if you know actual valuefan_energy_consumed = (hours_direct + hours_hrv) * fan_power / 1000 # kWh
# Net savingsnet_energy_savings = dehumidifier_energy_needed - fan_energy_consumed
print("="*60)print("ENERGY COMPARISON vs 330W DEHUMIDIFIER")print("="*60)print(f"Dehumidifier would use: {dehumidifier_energy_needed:,.1f} kWh")print(f"Ventilation fan uses: {fan_energy_consumed:,.1f} kWh")print(f"Net energy savings: {net_energy_savings:,.1f} kWh")print(f"\nAt 0.20 €/kWh:")print(f" Cost savings: {net_energy_savings * 0.20:,.2f} €")============================================================ENERGY COMPARISON vs 330W DEHUMIDIFIER============================================================Dehumidifier would use: 1,240.8 kWhVentilation fan uses: 73.4 kWhNet energy savings: 1,167.4 kWh
At 0.20 €/kWh: Cost savings: 233.48 €# Resample to weekly and count mode hoursdf_control['week'] = df_control['datetime'].dt.to_period('W').dt.start_timeweekly_mode = df_control.groupby(['week', 'mode']).size() * time_intervalweekly_mode = weekly_mode.unstack(fill_value=0)
# Create stacked bar chartfig, ax = plt.subplots(figsize=(14, 6))weekly_mode.plot(kind='bar', stacked=True, ax=ax, color={'direct': '#FF6B6B', 'hrv': '#4ECDC4', 'off': '#95A5A6'}, width=0.8)
ax.set_xlabel('Week')ax.set_ylabel('Hours')ax.set_title('Ventilation Mode Distribution by Week')ax.legend(title='Mode', labels=['Direct Intake', 'HRV', 'Off'])ax.grid(axis='y', alpha=0.3)
# Show only every 4th week label (monthly)tick_positions = range(0, len(weekly_mode), 4)ax.set_xticks(tick_positions)ax.set_xticklabels([weekly_mode.index[i].strftime('%Y-%m') for i in tick_positions], rotation=45, ha='right')
plt.tight_layout()plt.show()
print("✓ Weekly mode distribution with readable labels")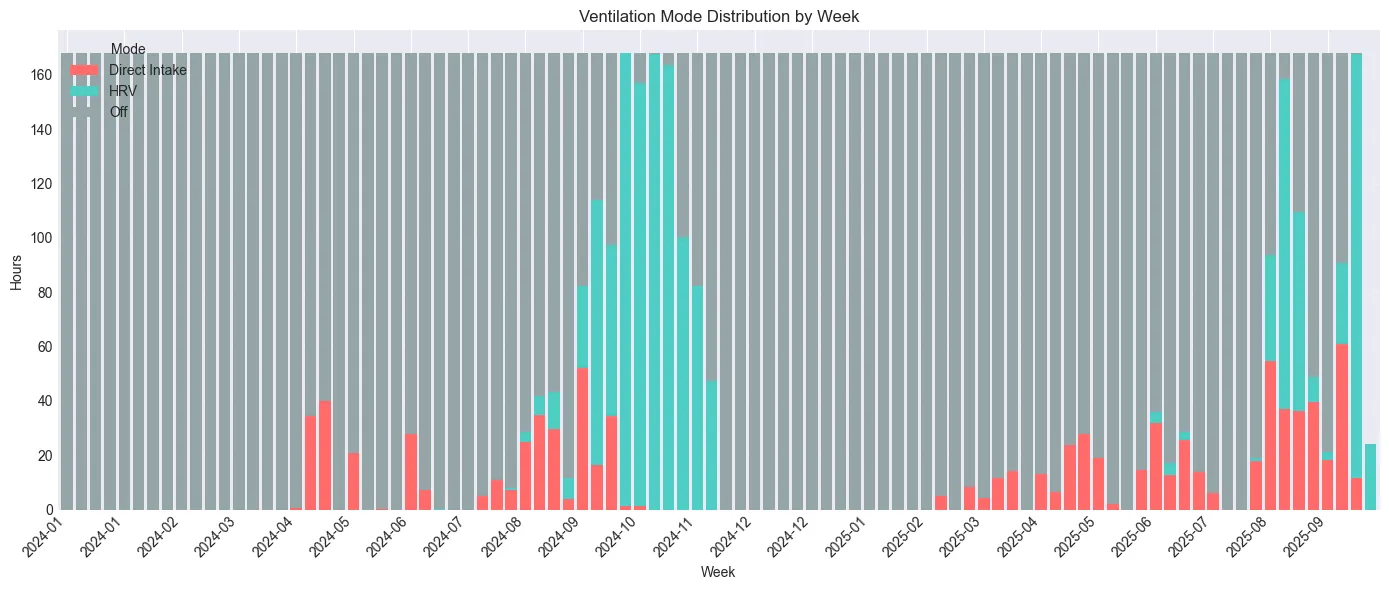
✓ Weekly mode distribution with readable labels