Basement Heat Extractor Analysis
Introduction
Section titled “Introduction”This analysis explores an active heating approach for basement temperature management during warm months. Inspired by this double-flow ventilation project, we investigate a closed-loop heat extraction system that circulates basement air through a heat exchanger (aluminum plates) to capture heat from warmer outdoor air.
The key difference from traditional ventilation systems: this is a closed loop that extracts heat from outdoor air without exchanging air. Basement air circulates through aluminum plates exposed to outdoor conditions, absorbing heat when outdoor temperature exceeds basement temperature, while maintaining indoor air quality and avoiding humidity issues from outdoor air intake.
Analysis Goals
Section titled “Analysis Goals”Using actual weather data and basement temperature profiles for 2024-2025, we quantify:
- Operational window - Hours when outdoor temperature exceeds basement temperature (heat extraction is possible)
- Heating potential - Total heat that can be transferred to the basement through the aluminum heat exchanger
- System efficiency - Temperature increase achievable with a 100 m³/h circulation rate and 60% heat exchanger efficiency
The document presents the complete computational analysis, from baseline environment modeling through performance evaluation.
# Step 1: Import librariesimport pandas as pdimport matplotlib.pyplot as pltimport seaborn as snsimport numpy as npfrom datetime import datetime
# Set styleplt.style.use('seaborn-v0_8-darkgrid')sns.set_palette("husl")
print("✓ Libraries imported")
✓ Libraries importedBasement data & extrapolation
Section titled “Basement data & extrapolation”# Step 2: Load basement temperature dataprint("\n" + "="*60)print("LOADING BASEMENT TEMPERATURE DATA")print("="*60)
# First, let's check the structure of the basement datadf_basement = pd.read_csv('../basement_temp.csv', sep=';')
# Show what we haveprint(f"\nData range: {df_basement['date'].min()} to {df_basement['date'].max()}")print(f"Number of records: {len(df_basement)}")print(f"\nFirst few rows:")print(df_basement.head())print(f"\nLast few rows:")print(df_basement.tail())print(f"\nTemperature range: {df_basement['temperature'].min():.1f}°C to {df_basement['temperature'].max():.1f}°C")============================================================LOADING BASEMENT TEMPERATURE DATA============================================================
Data range: 2024-09-16 to 2025-03-17Number of records: 38
First few rows: date temperature0 2024-09-16 16.51 2024-09-20 15.82 2024-09-25 15.23 2024-10-01 13.54 2024-10-05 14.5
Last few rows: date temperature33 2025-03-01 6.534 2025-03-05 6.535 2025-03-10 7.536 2025-03-15 8.237 2025-03-17 7.8
Temperature range: 6.2°C to 16.5°C# start extrapolation
# Create full year date rangesdate_range_2024 = pd.date_range(start='2024-01-01', end='2024-12-31', freq='D')date_range_2025 = pd.date_range(start='2025-01-01', end='2025-12-31', freq='D')
# Combine themfull_date_range = pd.concat([ pd.Series(date_range_2024), pd.Series(date_range_2025)], ignore_index=True)
print(f"\nTarget date range: {full_date_range.min()} to {full_date_range.max()}")print(f"Total days to fill: {len(full_date_range)}")Target date range: 2024-01-01 00:00:00 to 2025-12-31 00:00:00Total days to fill: 731# Make sure date is datetime (in case kernel was restarted)df_basement['date'] = pd.to_datetime(df_basement['date'])
# Add day of year to existing datadf_basement['day_of_year'] = df_basement['date'].dt.dayofyear
# Fit sinusoidal curvemean_temp = df_basement['temperature'].mean()amplitude = (df_basement['temperature'].max() - df_basement['temperature'].min()) / 2peak_day = 250 # Early September
print(f"\nFitted parameters:")print(f" Mean temperature: {mean_temp:.1f}°C")print(f" Amplitude: {amplitude:.1f}°C")print(f" Peak day: {peak_day} (around Sep 6)")Fitted parameters: Mean temperature: 9.8°C Amplitude: 5.2°C Peak day: 250 (around Sep 6)# Generate temp for all 731 days# Create dataframe with all daysdf_full = pd.DataFrame({'date': full_date_range})df_full['day_of_year'] = df_full['date'].dt.dayofyear
# Generate temperature using sinusoidal curvedf_full['temperature'] = mean_temp + amplitude * np.cos(2 * np.pi * (df_full['day_of_year'] - peak_day) / 365)
# Cap at 18°C maximum as requesteddf_full['temperature'] = df_full['temperature'].clip(upper=18.0)
print(f"\nGenerated {len(df_full)} days of data")print(f"Temperature range: {df_full['temperature'].min():.1f}°C to {df_full['temperature'].max():.1f}°C")print(f"\nFirst few days:")print(df_full.head())Generated 731 days of dataTemperature range: 4.6°C to 14.9°C
First few days: date day_of_year temperature0 2024-01-01 1 7.6663521 2024-01-02 2 7.5859432 2024-01-03 3 7.5061893 2024-01-04 4 7.4271134 2024-01-05 5 7.348739# Create the plotplt.figure(figsize=(12, 5))plt.plot(df_full['date'], df_full['temperature'], linewidth=1.5)plt.xlabel('Date')plt.ylabel('Temperature (°C)')plt.title('Basement Temperature - Extrapolated 2024-2025')plt.grid(True, alpha=0.3)plt.tight_layout()plt.show()
print("✓ Plot created")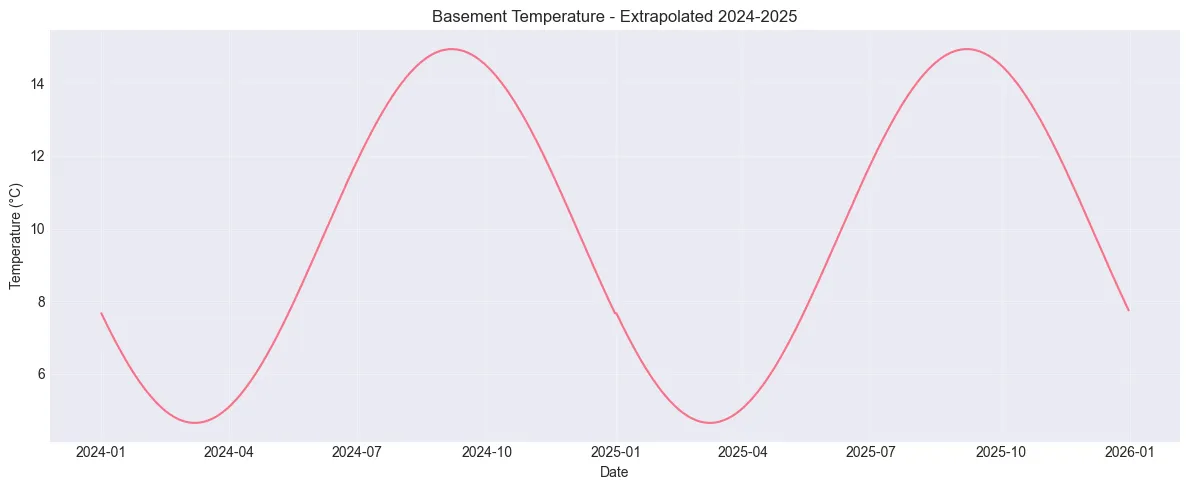
✓ Plot createdFMI data fetching using https://github.com/fmidev/opendata-resources.git
Section titled “FMI data fetching using https://github.com/fmidev/opendata-resources.git”Modified script
Section titled “Modified script”import requestsimport datetime as dtimport xml.etree.ElementTree as ETimport numpy as npimport reimport argparse
def get_param_names(url): """ Get parameters metadata """ req = requests.get(url) params = {}
if req.status_code == 200: xmlstring = req.content tree = ET.ElementTree(ET.fromstring(xmlstring)) for p in tree.iter(tag='{http://inspire.ec.europa.eu/schemas/omop/2.9}ObservableProperty'): params[p.get('{http://www.opengis.net/gml/3.2}id')] = p.find('{http://inspire.ec.europa.eu/schemas/omop/2.9}label').text return params
def get_params(tree): """ Get parameters from response xml tree """
retParams = [] for el in tree.iter(tag='{http://www.opengis.net/om/2.0}observedProperty'): url = el.get('{http://www.w3.org/1999/xlink}href') params = re.findall(r"(?<=param=).*,.*(?=&)", url)[0].split(',')
param_names = get_param_names(url) for p in params: retParams.append('{} ({})'.format(param_names[p], p))
return retParams
def get_positions(tree): """ Function to get times and coordinates from multipointcoverage answer """ positions = [] for el in tree.iter(tag='{http://www.opengis.net/gmlcov/1.0}positions'): pos = el.text.split() i = 0 while len(pos) > 0: lat = float(pos.pop(0)) lon = float(pos.pop(0)) timestamp = int(pos.pop(0)) positions.append([lat,lon,timestamp]) return np.array(positions)
def main(): """ Get weather data from location and save it as csv """
url = 'http://opendata.fmi.fi/wfs' daystep = 7 # Fetch 7 days at a time for better performance
starttime = dt.datetime.strptime(options.starttime, '%Y-%m-%d') endtime = dt.datetime.strptime(options.endtime, '%Y-%m-%d')
# Location coordinates # Using bbox or fmisid for specific station
start = starttime end = start + dt.timedelta(days=daystep) if end > endtime: end = endtime
while end <= endtime and start < end: startStr = start.strftime('%Y-%m-%dT%H:%M:%SZ') endStr = end.strftime('%Y-%m-%dT%H:%M:%SZ')
# Get data for location area # Using bbox (bounding box) covering the area payload = { 'request': 'getFeature', 'storedquery_id': 'fmi::observations::weather::multipointcoverage', 'bbox': options.bbox, 'starttime': startStr, 'endtime': endStr, }
# If specific parameters requested, add them if options.parameters: payload['parameters'] = options.parameters
print('Fetching data from {} to {}...'.format(startStr, endStr)) try: r = requests.get(url, params=payload, timeout=60) except Exception as e: print('Network error: {}. Retrying after 5 seconds...'.format(e)) import time time.sleep(5) try: r = requests.get(url, params=payload, timeout=60) except Exception as e2: print('Second attempt failed: {}. Skipping this interval.'.format(e2)) start = end end = start + dt.timedelta(days=daystep) if end > endtime: end = endtime continue
if r.status_code != 200: print('Error: HTTP status {}'.format(r.status_code)) print('Response:', r.text[:500]) start = end end = start + dt.timedelta(days=daystep) if end > endtime: end = endtime continue
# Construct XML tree tree = ET.ElementTree(ET.fromstring(r.content))
# Get geospatial and temporal positions of data elements positions = get_positions(tree)
if len(positions) == 0: print('No data found for this time interval') start = end end = start + dt.timedelta(days=daystep) if end > endtime: end = endtime continue
# Extract data from XML tree d = [] for el in tree.iter(tag='{http://www.opengis.net/gml/3.2}doubleOrNilReasonTupleList'): for pos in el.text.strip().split("\n"): d.append(pos.strip().split(' '))
# Assign data values to positions junk = np.append(positions, np.array(d), axis=1) try: data = np.append(data, junk, axis=0) except NameError: data = junk
print('Time interval {} - {} provided {} rows'.format(startStr, endStr, junk.shape[0]))
start = end end = start + dt.timedelta(days=daystep) if end > endtime: end = endtime
if 'data' not in locals(): print('No data found for the specified time period and location') return
print('Done fetching data. Final dimensions of the result: {}'.format(data.shape))
# Get params from the last XML tree element (they don't change over time) params = ['lat', 'lon', 'timestamp'] + get_params(tree)
# Convert timestamps to readable datetime strings print('Converting timestamps to readable dates...') readable_dates = [] for row in data: timestamp = int(float(row[2])) dt_obj = dt.datetime.utcfromtimestamp(timestamp) readable_dates.append(dt_obj.strftime('%Y-%m-%d %H:%M:%S'))
# Insert readable datetime column after timestamp readable_dates_array = np.array(readable_dates).reshape(-1, 1) data_with_datetime = np.hstack((data[:, :3], readable_dates_array, data[:, 3:]))
# Update params list to include datetime column params_with_datetime = ['lat', 'lon', 'timestamp', 'datetime'] + get_params(tree)
# Save with mixed format (floats for numbers, strings for datetime) print('Saving to CSV...') with open(options.filename, 'w') as f: # Write header f.write(';'.join(params_with_datetime) + '\n') # Write data rows for row in data_with_datetime: # lat, lon, timestamp as floats, datetime as string, rest as floats formatted = '{:.5f};{:.5f};{:.5f};{};{}'.format( float(row[0]), float(row[1]), float(row[2]), row[3], ';'.join(['{:.5f}'.format(float(x)) for x in row[4:]]) ) f.write(formatted + '\n')
print('Data saved to {}'.format(options.filename))
if __name__=='__main__':
parser = argparse.ArgumentParser( description='Fetch weather observations from FMI Open Data' )
parser.add_argument('--filename', type=str, default='weather.csv', help='Filename to save the data (default: weather.csv)') parser.add_argument('--starttime', type=str, required=True, help='Starttime in format Y-m-d (e.g., 2024-01-01)') parser.add_argument('--endtime', type=str, required=True, help='Endtime in format Y-m-d (e.g., 2024-01-31)') parser.add_argument('--bbox', type=str, default='XX.X,XX.X,XX.X,XX.X', help='Bounding box as lon_min,lat_min,lon_max,lat_max') parser.add_argument('--parameters', type=str, default='temperature,humidity,dewpoint', help='Comma-separated list of parameters (default: temperature,humidity,dewpoint)')
options = parser.parse_args()
main()Loading fetched data
Section titled “Loading fetched data”# Step 2A: Load your CSV# Replace 'your_file.csv' with your actual filenamedf = pd.read_csv('../weather_jan24_sep25.csv', sep=';')
# Rename columns to simpler namesdf.columns = ['lat', 'lon', 'timestamp', 'datetime', 'temp', 'humidity', 'dewpoint']
# Load outside weather datadf_outside = pd.read_csv('../weather_jan24_sep25.csv', sep=';')df_outside.columns = ['lat', 'lon', 'timestamp', 'datetime', 'temp', 'humidity', 'dewpoint']
# Convert datetime to proper formatdf_outside['datetime'] = pd.to_datetime(df_outside['datetime'])
print(f"\nOutside weather data range: {df_outside['datetime'].min()} to {df_outside['datetime'].max()}")print(f"Number of records: {len(df_outside)}")print(f"\nFirst few rows:")print(df_outside.head())print(f"\nTemperature range: {df_outside['temp'].min():.1f}°C to {df_outside['temp'].max():.1f}°C")print(f"Dewpoint range: {df_outside['dewpoint'].min():.1f}°C to {df_outside['dewpoint'].max():.1f}°C")Outside weather data range: 2024-01-01 00:00:00 to 2025-09-30 00:00:00Number of records: 906627
First few rows: lat lon timestamp datetime temp humidity \0 XX.XXXXX XX.XXXXX 1.704067e+09 2024-01-01 00:00:00 -11.7 88.01 XX.XXXXX XX.XXXXX 1.704068e+09 2024-01-01 00:10:00 -11.7 89.02 XX.XXXXX XX.XXXXX 1.704068e+09 2024-01-01 00:20:00 -11.7 90.03 XX.XXXXX XX.XXXXX 1.704069e+09 2024-01-01 00:30:00 -11.9 89.04 XX.XXXXX XX.XXXXX 1.704070e+09 2024-01-01 00:40:00 -11.9 89.0
dewpoint0 -13.31 -13.12 -13.03 -13.34 -13.3
Temperature range: -19.5°C to 26.8°CDewpoint range: -21.6°C to 22.4°C# uniform resolution# Set datetime as index for resamplingdf_outside_resampled = df_outside.set_index('datetime')
# Resample to 10-minute intervals (mean of values within each period)df_outside_10min = df_outside_resampled[['temp', 'humidity', 'dewpoint']].resample('10min').mean()df_outside_10min = df_outside_10min.reset_index()df_outside_10min.columns = ['datetime', 'temp', 'humidity', 'dewpoint']
print(f"After resampling to 10-minute intervals:")print(f" Records: {len(df_outside_10min):,}")print(f" Expected for {638} days: {638*24*6:,}")print(f"\nFirst few rows:")print(df_outside_10min.head())After resampling to 10-minute intervals: Records: 91,873 Expected for 638 days: 91,872
First few rows: datetime temp humidity dewpoint0 2024-01-01 00:00:00 -10.054545 90.545455 -11.3181821 2024-01-01 00:10:00 -10.100000 90.363636 -11.3818182 2024-01-01 00:20:00 -10.081818 90.545455 -11.3272733 2024-01-01 00:30:00 -10.063636 90.545455 -11.2909094 2024-01-01 00:40:00 -10.063636 90.818182 -11.272727# Create a new dataframe matching outside data timestampsdf_control = df_outside_10min[['datetime', 'temp', 'humidity', 'dewpoint']].copy()df_control.columns = ['datetime', 'outside_temp', 'outside_humidity', 'outside_dewpoint']
# Extract just the date for merging with daily basement datadf_control['date'] = df_control['datetime'].dt.datedf_control['date'] = pd.to_datetime(df_control['date'])
# Merge with basement daily datadf_control = df_control.merge(df_full[['date', 'temperature']], on='date', how='left')df_control.columns = ['datetime', 'outside_temp', 'outside_humidity', 'outside_dewpoint', 'date', 'basement_temp']
print(f"\nControl dataframe: {len(df_control)} records at 10-minute intervals")print(df_control.head())Control dataframe: 91873 records at 10-minute intervals datetime outside_temp outside_humidity outside_dewpoint \0 2024-01-01 00:00:00 -10.054545 90.545455 -11.3181821 2024-01-01 00:10:00 -10.100000 90.363636 -11.3818182 2024-01-01 00:20:00 -10.081818 90.545455 -11.3272733 2024-01-01 00:30:00 -10.063636 90.545455 -11.2909094 2024-01-01 00:40:00 -10.063636 90.818182 -11.272727
date basement_temp0 2024-01-01 7.6663521 2024-01-01 7.6663522 2024-01-01 7.6663523 2024-01-01 7.6663524 2024-01-01 7.666352# Resample to daily averages for readabilitydaily_temps = df_control.groupby(df_control['datetime'].dt.date).agg({ 'basement_temp': 'mean', 'outside_temp': 'mean'}).reset_index()daily_temps.columns = ['date', 'basement_temp', 'outside_temp']daily_temps['date'] = pd.to_datetime(daily_temps['date'])
# Create line plotfig, ax = plt.subplots(figsize=(14, 6))ax.plot(daily_temps['date'], daily_temps['outside_temp'], label='Outside', color='#3498db', linewidth=1.5, alpha=0.8)ax.plot(daily_temps['date'], daily_temps['basement_temp'], label='Basement', color='#e74c3c', linewidth=2)
ax.axhline(y=10, color='gray', linestyle='--', alpha=0.5, label='10°C safety limit')ax.set_xlabel('Date')ax.set_ylabel('Temperature (°C)')ax.set_title('Basement vs Outside Temperature (Daily Average)')ax.legend()ax.grid(True, alpha=0.3)plt.tight_layout()plt.show()
print("✓ Temperature comparison chart created")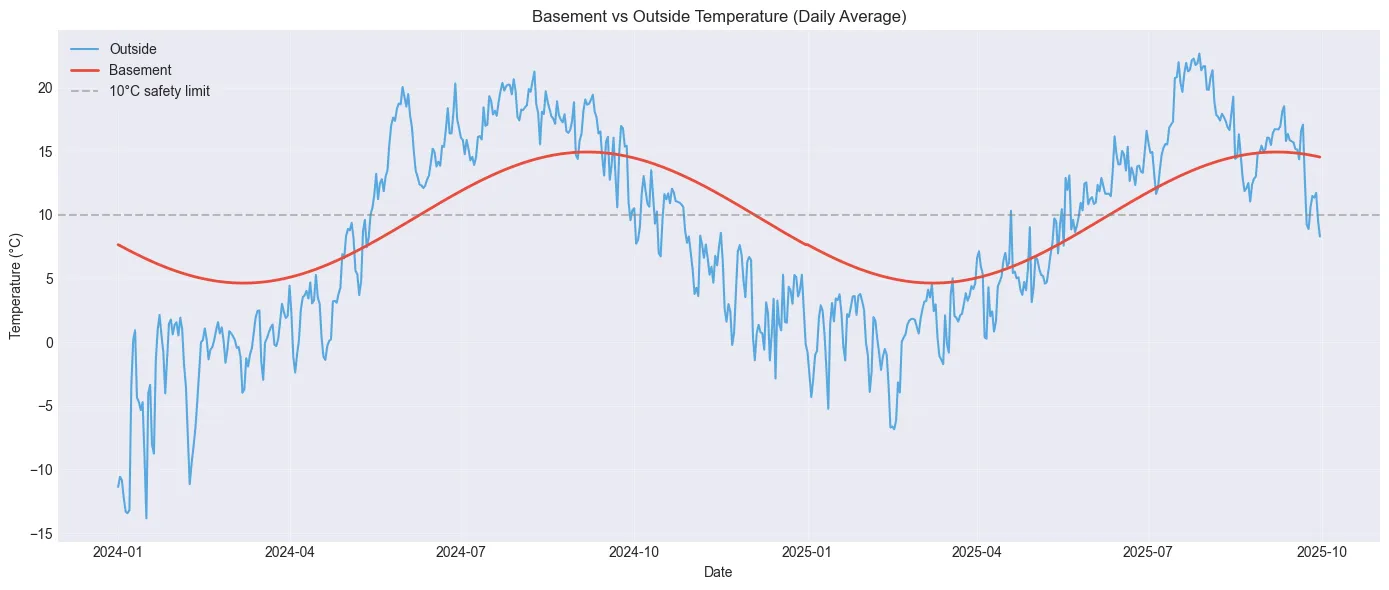
✓ Temperature comparison chart created# Determine operation mode for each 10-minute perioddef determine_mode(row): # ON: outside warmer than basement (can extract heat to cool basement) if row['outside_temp'] > row['basement_temp']: return 'on' else: return 'off'
df_control['mode'] = df_control.apply(determine_mode, axis=1)
# Sample randomly across the datasetsample_indices = np.linspace(0, len(df_control)-1, 20, dtype=int)print(f"\nSample rows (spread across timeframe):")print(df_control.iloc[sample_indices][['datetime', 'outside_temp', 'basement_temp', 'mode']])Sample rows (spread across timeframe): datetime outside_temp basement_temp mode0 2024-01-01 00:00:00 -10.054545 7.666352 off4835 2024-02-03 13:50:00 2.118182 5.477596 off9670 2024-03-08 03:40:00 -5.445455 4.644928 off14506 2024-04-10 17:40:00 4.063636 5.477596 off19341 2024-05-14 07:30:00 10.190909 7.747391 on24176 2024-06-16 21:20:00 14.945455 10.611318 on29012 2024-07-20 11:20:00 20.081818 13.284453 on33847 2024-08-23 01:10:00 16.636364 14.795902 on38682 2024-09-25 15:00:00 16.636364 14.671724 on43518 2024-10-29 05:00:00 5.000000 12.945952 off48353 2024-12-01 18:50:00 6.663636 10.259533 off53189 2025-01-04 08:50:00 -1.745455 7.427113 off58024 2025-02-06 22:40:00 0.681818 5.338404 off62859 2025-03-12 12:30:00 -0.509091 4.654081 off67695 2025-04-15 02:30:00 3.445455 5.681023 off72530 2025-05-18 16:20:00 14.218182 7.994052 on77365 2025-06-21 06:10:00 12.827273 10.959233 on82201 2025-07-24 20:10:00 20.850000 13.475305 on87036 2025-08-27 10:00:00 15.550000 14.852684 on91872 2025-09-30 00:00:00 8.300000 14.546331 off# Measure heat extraction potential# When ON: temperature difference shows cooling potentialdf_control['temp_delta'] = df_control['outside_temp'] - df_control['basement_temp']
# Only meaningful when system is ON (outside warmer than inside)df_control.loc[df_control['mode'] == 'off', 'temp_delta'] = 0
print(f"\nWhen system is ON:")print(df_control[df_control['mode']=='on'][['datetime', 'outside_temp', 'basement_temp', 'temp_delta']].describe())
print(f"\nSample of ON periods:")on_samples = df_control[df_control['mode']=='on'].sample(min(10, len(df_control[df_control['mode']=='on'])))print(on_samples[['datetime', 'outside_temp', 'basement_temp', 'temp_delta']])When system is ON: datetime outside_temp basement_temp \count 38247 38247.000000 38247.000000mean 2025-01-02 01:23:25.600439552 15.605453 11.798431min 2024-03-30 10:50:00 4.645455 4.64492825% 2024-07-10 19:45:00 12.963636 9.55103250% 2024-09-23 22:50:00 16.050000 12.50918775% 2025-07-03 06:25:00 18.381818 14.437471max 2025-09-27 14:30:00 25.663636 14.944737std NaN 3.995253 2.832324
temp_deltacount 38247.000000mean 3.807022min 0.00012625% 1.65687250% 3.23126675% 5.373699max 14.026754std 2.698175
Sample of ON periods: datetime outside_temp basement_temp temp_delta27099 2024-07-07 04:30:00 15.236364 12.356930 2.87943325930 2024-06-29 01:40:00 18.254545 11.719393 6.53515223057 2024-06-09 02:50:00 12.827273 9.994157 2.83311673342 2025-05-24 07:40:00 9.727273 8.501108 1.22616576352 2025-06-14 05:20:00 15.272727 10.347751 4.92497687841 2025-09-02 00:10:00 14.950000 14.925672 0.02432832685 2024-08-14 23:30:00 15.663636 14.546331 1.11730673694 2025-05-26 18:20:00 9.418182 8.673462 0.74472088553 2025-09-06 22:50:00 16.550000 14.943974 1.60602684409 2025-08-09 04:10:00 17.550000 14.316231 3.233769# System parametersbasement_volume = 80 # m³max_fan_capacity = 269.3 # m³/h
# Airflow rate through heat extractorairflow_rate = 100 # m³/h - circulation rate through aluminum plates
# Heat exchanger efficiency (aluminum plates)heat_exchanger_efficiency = 0.6 # 60% - aluminum plate heat exchanger
# Time per recordtime_interval = 10 / 60 # 10 minutes in hours
print("System configuration:")print(f" Basement volume: {basement_volume} m³")print(f" Operating airflow: {airflow_rate} m³/h ({airflow_rate/max_fan_capacity*100:.1f}% of max)")print(f" Air changes per hour: {airflow_rate/basement_volume:.2f}")print(f" Heat exchanger efficiency: {heat_exchanger_efficiency*100:.0f}%")print(f" Time resolution: {time_interval*60:.0f} minutes per record")System configuration: Basement volume: 80 m³ Operating airflow: 100 m³/h (37.1% of max) Air changes per hour: 1.25 Heat exchanger efficiency: 60% Time resolution: 10 minutes per record# Calculate hours in each modemode_counts = df_control['mode'].value_counts()
hours_on = (mode_counts.get('on', 0) * time_interval)hours_off = (mode_counts.get('off', 0) * time_interval)total_hours = len(df_control) * time_interval
print("="*60)print("OPERATIONAL HOURS")print("="*60)print(f"System ON: {hours_on:,.0f} hours ({hours_on/total_hours*100:.1f}%)")print(f"System OFF: {hours_off:,.0f} hours ({hours_off/total_hours*100:.1f}%)")print(f"Total period: {total_hours:,.0f} hours")============================================================OPERATIONAL HOURS============================================================System ON: 6,374 hours (41.6%)System OFF: 8,938 hours (58.4%)Total period: 15,312 hours# Calculate heat TRANSFER TO basement when system is ON# Air propertiesair_density = 1.25 # kg/m³ at ~10°Cspecific_heat_air = 1005 # J/(kg·K)
# Mass flow ratemass_flow_rate = airflow_rate * air_density / 3600 # kg/s
# Heat transferred TO basement (W) for each 10-minute period when ON# Q = mass_flow × specific_heat × temp_difference × efficiencydf_control['heat_gained_W'] = 0.0df_control.loc[df_control['mode'] == 'on', 'heat_gained_W'] = ( mass_flow_rate * specific_heat_air * df_control.loc[df_control['mode'] == 'on', 'temp_delta'] * heat_exchanger_efficiency)
# Energy gained by basement per period (kWh)df_control['energy_gained_kWh'] = df_control['heat_gained_W'] * time_interval / 1000
print("="*60)print("HEAT TRANSFER TO BASEMENT")print("="*60)print(f"Mass flow rate: {mass_flow_rate:.4f} kg/s")print(f"\nWhen system is ON:")print(f" Average heating power: {df_control[df_control['mode']=='on']['heat_gained_W'].mean():.0f} W")print(f" Max heating power: {df_control['heat_gained_W'].max():.0f} W")print(f" Total energy gained: {df_control['energy_gained_kWh'].sum():.1f} kWh")============================================================HEAT TRANSFER TO BASEMENT============================================================Mass flow rate: 0.0347 kg/s
When system is ON: Average heating power: 80 W Max heating power: 294 W Total energy gained: 508.1 kWh# Check sample data to see what's happeningprint("="*60)print("DEBUG: Check actual temperatures and modes")print("="*60)
# Sample from January (winter)jan_sample = df_control[df_control['datetime'].dt.month == 1].head(10)print("\nJanuary sample (should be mostly OFF):")print(jan_sample[['datetime', 'outside_temp', 'basement_temp', 'mode']])
# Sample from July (summer)july_sample = df_control[df_control['datetime'].dt.month == 7].head(10)print("\nJuly sample (should be mostly ON):")print(july_sample[['datetime', 'outside_temp', 'basement_temp', 'mode']])
# Count by monthmonthly_on = df_control[df_control['mode'] == 'on'].groupby(df_control['datetime'].dt.month).size()print("\nON hours by month:")print(monthly_on)============================================================DEBUG: Check actual temperatures and modes============================================================
January sample (should be mostly OFF): datetime outside_temp basement_temp mode0 2024-01-01 00:00:00 -10.054545 7.666352 off1 2024-01-01 00:10:00 -10.100000 7.666352 off2 2024-01-01 00:20:00 -10.081818 7.666352 off3 2024-01-01 00:30:00 -10.063636 7.666352 off4 2024-01-01 00:40:00 -10.063636 7.666352 off5 2024-01-01 00:50:00 -9.945455 7.666352 off6 2024-01-01 01:00:00 -10.027273 7.666352 off7 2024-01-01 01:10:00 -10.154545 7.666352 off8 2024-01-01 01:20:00 -10.336364 7.666352 off9 2024-01-01 01:30:00 -10.400000 7.666352 off
July sample (should be mostly ON): datetime outside_temp basement_temp mode26208 2024-07-01 00:00:00 16.276923 11.882679 on26209 2024-07-01 00:10:00 16.163636 11.882679 on26210 2024-07-01 00:20:00 16.181818 11.882679 on26211 2024-07-01 00:30:00 16.209091 11.882679 on26212 2024-07-01 00:40:00 16.200000 11.882679 on26213 2024-07-01 00:50:00 16.200000 11.882679 on26214 2024-07-01 01:00:00 16.181818 11.882679 on26215 2024-07-01 01:10:00 16.200000 11.882679 on26216 2024-07-01 01:20:00 16.381818 11.882679 on26217 2024-07-01 01:30:00 16.490909 11.882679 on
ON hours by month:datetime3 3564 16635 63186 84977 86048 71869 556510 58dtype: int64# Dehumidification savings calculationenergy_per_liter = 0.5 # kWh/L - realistic consumer dehumidifierbaseline_rh = 75 # % baseline basement humidity
print("="*60)print("DEHUMIDIFICATION SAVINGS FROM HEATING")print("="*60)
# Calculate absolute humidity at baseline conditions (75% RH)# Using Magnus formula for saturation vapor pressuredef calc_absolute_humidity(temp_c, rh_percent): """Calculate absolute humidity in kg/m³""" svp = 611.2 * np.exp((17.62 * temp_c) / (243.12 + temp_c)) # Pa vapor_pressure = (rh_percent / 100) * svp # Absolute humidity = vapor_pressure / (R_v × T) # R_v = 461.5 J/(kg·K) abs_humidity = vapor_pressure / (461.5 * (temp_c + 273.15)) return abs_humidity
# For ON periods: calculate water that would need to be removeddf_control['water_saved_kg'] = 0.0
# When system is ON, heating reduces RHon_mask = df_control['mode'] == 'on'if on_mask.any(): # Absolute humidity at 75% RH (before heating) df_control.loc[on_mask, 'abs_humidity_75'] = calc_absolute_humidity( df_control.loc[on_mask, 'basement_temp'], 75 )
# Absolute humidity after heating (same water content, but lower RH due to higher temp) # RH after heating was already calculated df_control.loc[on_mask, 'abs_humidity_after'] = calc_absolute_humidity( df_control.loc[on_mask, 'heated_basement_temp'], df_control.loc[on_mask, 'rh_after'] )
# Water that doesn't need removing thanks to heating (kg) # (Same absolute humidity, so this is actually zero - let me recalculate...)
# Actually: the equivalent water removal is based on RH reduction # From 75% to rh_after at the SAME temperature df_control.loc[on_mask, 'abs_humidity_target'] = calc_absolute_humidity( df_control.loc[on_mask, 'basement_temp'], # Before heating temp df_control.loc[on_mask, 'rh_after'] # Target RH )
# Water that would have been removed by dehumidifier (kg) df_control.loc[on_mask, 'water_saved_kg'] = basement_volume * ( df_control.loc[on_mask, 'abs_humidity_75'] - df_control.loc[on_mask, 'abs_humidity_target'] )
# Energy saved (kWh)df_control['dehumidifier_energy_saved_kWh'] = df_control['water_saved_kg'] * energy_per_liter
total_water_saved = df_control['water_saved_kg'].sum()total_energy_saved = df_control['dehumidifier_energy_saved_kWh'].sum()
print(f"\nEquivalent water removal from heating: {total_water_saved:.1f} kg (liters)")print(f"Dehumidifier energy that would have been used: {total_energy_saved:.1f} kWh")print(f"\nTotal heat gained from outside: {df_control['energy_gained_kWh'].sum():.1f} kWh")print(f"Equivalent dehumidification savings: {total_energy_saved:.1f} kWh")============================================================DEHUMIDIFICATION SAVINGS FROM HEATING============================================================
Equivalent water removal from heating: 3963.4 kg (liters)Dehumidifier energy that would have been used: 1981.7 kWh
Total heat gained from outside: 508.1 kWhEquivalent dehumidification savings: 1981.7 kWh